Overview of Boston’s South End Neighborhood
Introduction to Living in the South End
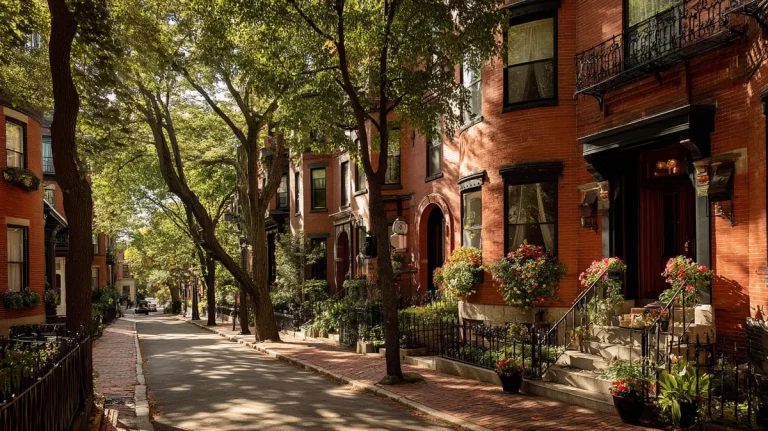
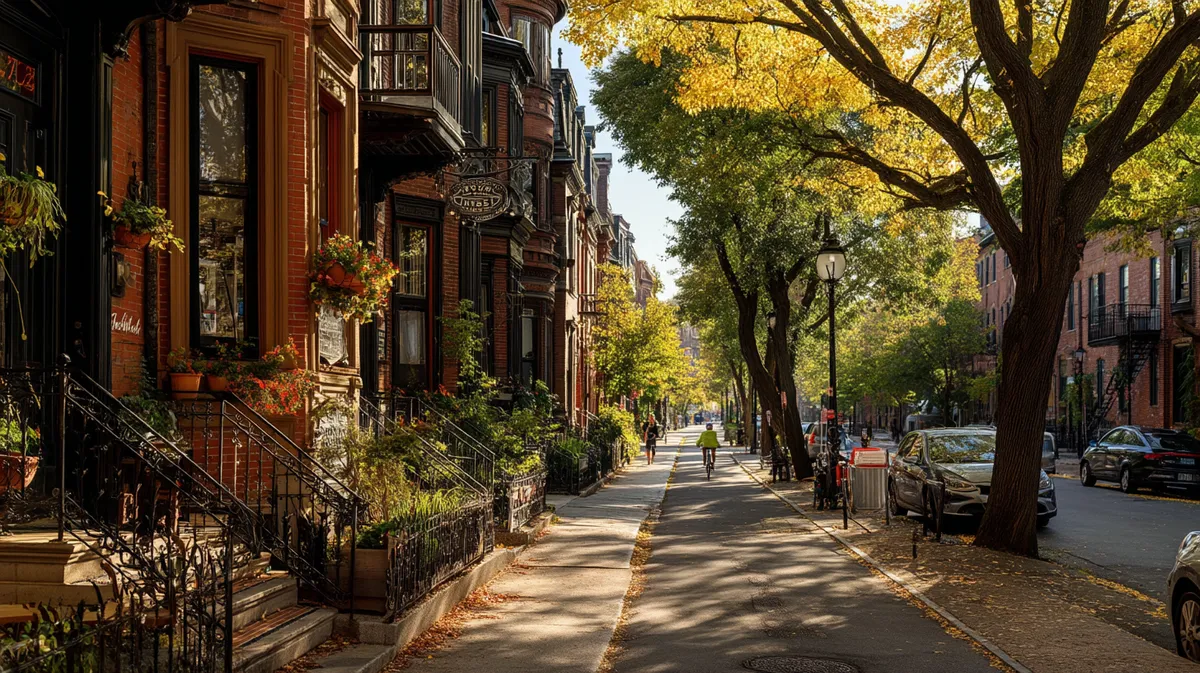
Step onto Tremont Street on a Saturday morning, and it feels like every brownstone stoop doubles as a front-row seat to café chatter, dog walkers, and the soft rumble of the trolley headed toward the Prudential Center.
The South End is also home to SoWa Art & Design District, where contemporary art galleries share repurposed warehouses with live music pop-ups and vintage markets.
It is a neighborhood in Boston that pulls together leafy pocket parks, Victorian architecture, and a dining scene that ranges from Dominican bakeries to white-tablecloth fine dining.
Folks hunting for homes for sale in the South End soon learn that the vibe is equal parts historic charm and urban energy.
Geographical Location
The South End sits just south of Back Bay and west of downtown, with Massachusetts Avenue marking its western border and the Southeast Expressway skirting the east.
Roxbury wraps the southern edge, while South Boston and the Seaport District sit a quick ride away on the Silver Line. Easy access to public transportation is a daily perk.
Back Bay Station links to both the Orange Line and commuter rail, and cross-town bus routes fan out toward Boston University, Fenway Park, and the Museum of Fine Arts. Cyclists trace Columbus Avenue’s protected lanes, and weekend runners loop around Blackstone Square for views of the city skyline.
Cost of Living in Boston South End
Life here is pricey.
Areavibes pegs the cost of living in the South End at 72% higher than the Boston average and 129% above the national average, with housing costs doing most of the heavy lifting.
RentCafe breaks it down further, noting that Boston overall runs about 46% higher than national norms, with housing roughly 119% above U.S. averages.
Groceries and utilities also sit north of what you will find in many U.S. cities, though day-to-day expenses can be softened a bit by the neighborhood’s walkability, with no car payment, no downtown parking fees.
Still, prospective buyers should pencil out budgets carefully before deciding the South End is the neighborhood to live in, especially if they are comparing prices in Brighton or Allston, where brownstones give way to more affordable housing stock.
Boston South End Crime Reports and Data
Property Crime
South End posts a property crime rate of 15.12 incidents per 1,000 residents in a typical year, putting it a notch below Boston’s citywide average of roughly 20 per 1,000.
Most reports involve theft. CrimeGrade pegs plain-vanilla larcenies such as porch packages, unlocked bikes, phones left on café tables, at 11.94 per 1,000. Vehicle break-ins and catalytic-converter grabs show up more than outright car theft, but stolen-vehicle cases still run about 1.077 per 1,000 residents.
Risk shifts block to block.
A resident living near the West Newton Street brownstones faces roughly a 1-in-80 chance of seeing a property crime in a given year, while someone closer to the Southeast Expressway edge sits closer to 1-in-51.
Porch-cam footage and quick-response BPD bike teams have helped recover stolen e-bikes and track repeat package thieves, but locals still advise locking bikes inside and grabbing deliveries quickly.
Violent Crime
Violent crime in the South End runs 6.488 incidents per 1,000 residents according to CrimeGrade’s 2025 projection.
That rate is close to the citywide figure of 6.6 but almost double the Massachusetts state violent crime rate, which hovers near 3.7 per 1,000.
Assault and robbery make up the bulk of violent reports, while the murder rate sits at a relatively low 0.0555 per 1,000.
Other Crime
Vehicle theft registers 1.077 per 1,000 residents, and arson comes in at roughly 0.052 per 1,000.
While these numbers rarely grab headlines, they do feed into the total crime rate of 33.02 per 1,000 that includes both violent and property offenses.
Trends in Boston South End Crime Rates
Boston Police District D-4, which covers the South End, Back Bay, and parts of Fenway, recorded a 2% uptick in Part One crime through mid-2025 compared with the same stretch of 2024.
Citywide, Boston Police Department data show a 3% rise in total Part One offenses for 2024, driven mostly by larceny.
The silver lining: homicides fell to their lowest count since the 1950s, and shooting incidents edged down.
Comparing Crime Rates
Comparison of South End Crime Rates with Massachusetts
Stack the numbers side by side, and a pattern emerges.
The South End records about 6.5 violent crimes per 1,000 residents, nearly double the Massachusetts figure of roughly 3.1, while property crime runs 15.1 per 1,000 compared with the statewide 11.0.
That gap can look stark on paper, yet it reflects the reality of a dense urban pocket rather than a quiet Berkshire hill town. Every day, thousands of commuters glide through Back Bay Station, visitors stream to SoWa markets, and hospital traffic flows in and out of BMC, all of which add more opportunities for a quick phone grab or porch-package swipe.
Context matters. The South End’s brownstone blocks are packed tighter than much of Massachusetts, so a single theft cluster can nudge the rate upward in ways spread-out suburbs never feel. At the same time, District D-4 fields one of the busiest patrol rosters in Boston, meaning response times are fast and surveillance cameras blanket busy corridors.
For many locals, the trade-off is clear: accept a slightly higher risk of petty theft in exchange for walk-everywhere convenience, live music on Tremont Street, and a restaurant and bar lineup that keeps the sidewalks busy, and therefore well-lit, long after the last commuter rail pulls out.
Crime Rate Comparison with Nearby Neighborhoods
Roxbury posts a violent crime rate of 6.951 per 1,000 and a property rate north of 25 per 1,000, outpacing the South End on both fronts.
Back Bay, by contrast, has a lower violent rate but grapples with high theft tied to dense retail corridors near Copley Square and the Prudential Center.
Beacon Hill residents see roughly a 1-in-29 chance of property crime and a 1-in-171 chance of violent crime. Better odds than the South End, but still not immune to pickpocketing around the State House and Boston Common.
Fenway-Kenmore logs an overall crime rate of 29.4 per 1,000, slightly below the South End, though game days near Fenway Park can spike petty thefts.
In short, the South End lands somewhere in the middle of Boston neighborhoods: safer than Roxbury, rougher than Beacon Hill, comparable to Fenway, and edging out Back Bay once late-night bar hours are factored in.
Safety Measures and Resources
Chance of Being a Victim of Crime as a South End Resident
CrimeGrade’s model gives South End residents a 1-in-30 chance of experiencing any crime in a given year, with odds tightening to 1-in-25 in the southeast pocket near I-93 and loosening to 1-in-36 around the West Newton Street brownstones.
Walking at night, most locals stick to well-lit areas, keep headphones low, and stay aware of their surroundings. These simple habits that go a long way toward staying safe.
Role of the Boston Police Department
The Boston Police Department maintains a visible presence through District D-4 headquarters on Harrison Avenue, daily foot patrols around Boston Medical Center, and mobile surveillance units during SoWa’s Sunday markets.
The department updates interactive crime maps within forty-eight hours so South End residents can track incidents street by street.
Officers also host quarterly community meetings at Blackstone Community Center, where neighbors swap tips about staying safe and flag issues like noisy restaurant and bar closings. The 27,000 square-foot D-4 station, opened in late 2024, includes a community room and a drive-through processing bay that keeps patrol cars on the street instead of circling for parking.
Each summer, the Reveler Action Plan adds extra bicycle and walking patrols from Thursday through Sunday night to cover package-theft hotspots and bar-closing crowds.
On quieter weeks, you might see officers pouring coffee at a pop-up “Coffee with a Cop” in Blackstone Square or reading to third-graders at the nearby Blackstone School. These simple gestures help residents put a name to a badge and funnel anonymous tips into the Crime Stoppers line.
Community Safety Initiatives
Neighborhood associations in the South End push for extra lighting along Shawmut Avenue, fund private security near SoWa events, and run “porch cam” registries that feed footage to detectives investigating property crimes.
Boston University social-work interns partner with BMC to connect unhoused neighbors with services, reducing loitering complaints. Meanwhile, the city’s Vision Zero plan added speed-calming bump-outs along Columbus Avenue, cutting sideswipe collisions.
All of this creates a layered approach: police coverage, resident vigilance, and urban design tweaks aimed at making the South End one of the safest urban districts within Boston’s core.
Living in Boston South End: Is it a Safe Place to Live?
Ask ten South End residents how safe they feel, and you will hear ten different answers.
A graduate student renting on Rutland Street might rave about quick walks to the Museum of Fine Arts and trust crime maps to stay updated.
A long-time condo owner closer to Mass Ave might gripe about catalytic-converter theft but still call the South End safe compared with parts of Roxbury.
Overall crime sits above the Massachusetts state line yet below the most high-crime pockets of Boston, and the neighborhood benefits from constant foot traffic, robust transit, and few dark corners.
For many buyers, those positives offset the statistical bump in violent and property crimes.
Conclusion and Recommendations
Summary of Crime Statistics
Total crime lands at roughly 33 incidents per 1,000 residents, with property offenses making up almost half.
Violent crime sits near 6.5 per 1,000. This is higher than the state, on par with the city, and far lower than major U.S. outliers.
Package thefts and car break-ins remain the biggest headaches, while serious violent incidents are concentrated along a few corridors south of Washington Street.
Future Outlook for Crime in Boston South End
District D-4’s two-percent rise in 2025 suggests crime is not vanishing overnight, but citywide investments in street lighting, mental-health outreach, and gun-violence prevention hint at gradual improvement.
Continued growth around SoWa and the Seaport will likely keep foot traffic high, an informal deterrent, and long-planned pedestrian connections to the Greenway promise easier movement and more eyes on the street.
Boston South End Safety FAQs
Yes, statistical comparisons show lower property and violent crime rates in the South End than in Roxbury, where violent incidents run about 6.95 per 1,000 residents and property offenses surpass 25 per 1,000.
Crime maps point to the western blocks near Back Bay Station and the rows of brownstones around Southwest Corridor Park as having the lowest incident counts. Odds of becoming a victim drop to about 1 in 36 in those pockets.
The neighborhood’s total crime rate of roughly 33 per 1,000 exceeds the national average of about 23 per 1,000, mainly due to higher theft rates.
Violent crime sits slightly above the U.S. figure of about 4 per 1,000, while property crime lags just under national levels.
Back Bay and Mass Ave stops are almost always busy, with cameras above the platforms and transit cops roaming the turnstiles.
Things can still pop up, but the steady stream of riders and those wide, well-lit entrances usually make commuters feel pretty safe, especially when trains are coming one after another during rush hour.
Simple street smarts help: lock the bike, choose brighter routes, leave the porch light on, and keep an eye on what’s happening around you.
A lot of South End neighbors also link their doorbell cameras to a community watch feed, a small step that has sped up police work on porch pirates and strengthened the whole “we’ve got each other’s back” vibe.