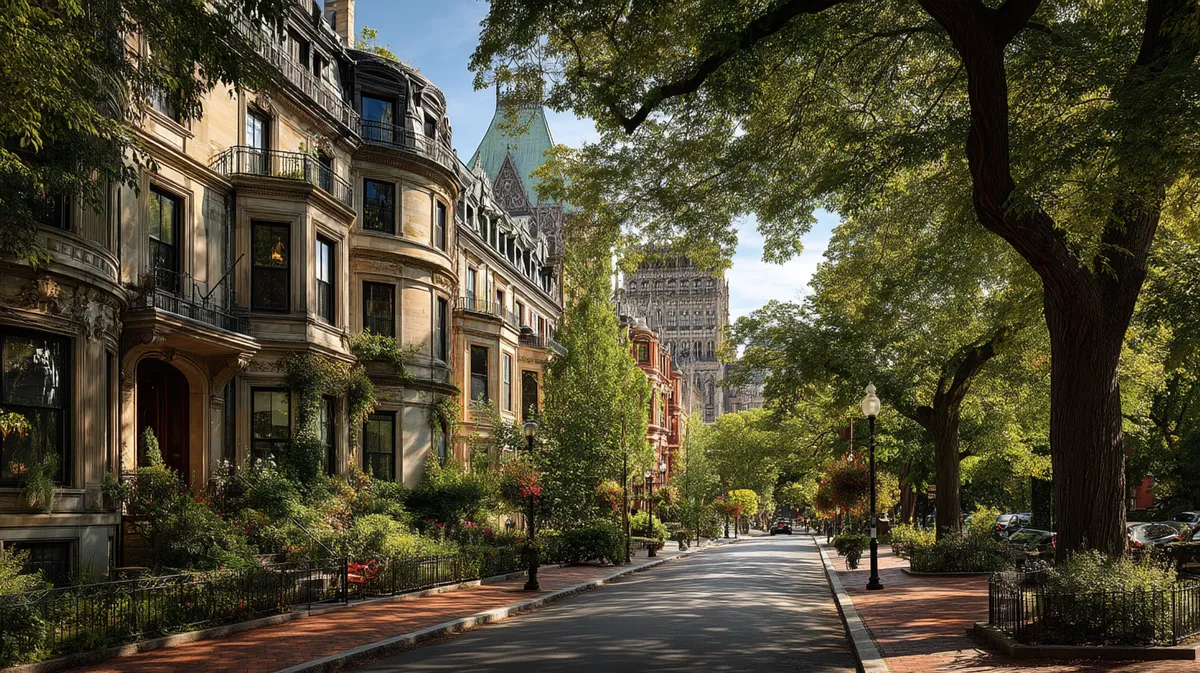
Back Bay sits on the Charles River side of Boston, a quick walk from downtown Boston but with its own slower rhythm. The neighborhood is known for Victorian brownstones, rows of mature trees along Commonwealth Avenue, and a steady hum of cafés and restaurants that spill out onto Newbury Street. Copley Square anchors the scene with the Boston Public Library’s grand reading rooms and a steady calendar of small events that give the plaza its pulse.
Most days feel lively rather than hectic. Residents and visitors weave between trendy boutiques and old-school diners, then drift toward the Esplanade for sunset views over the river. Back Bay Station keeps the area easily accessible, with the MBTA Orange Line, Commuter Rail, and Amtrak running under the neighborhood while the Green Line rolls along Boylston. Fenway Park sits just beyond the neighborhood line, yet nights in Back Bay tend to feel more polished than rowdy. It’s an upscale urban area that still feels walkable and human in scale.
Cost of Living in Back Bay
Back Bay is one of Boston’s pricier neighborhoods, and the income data reflect that reality.
City research estimates the neighborhood’s 2024 median household income at about $128,685, notably higher than the Boston citywide median of roughly $94,734. The same research places Back Bay’s population near 19,000 and shows a housing mix that leans heavily to studios and one-bedroom units, which tracks with the area’s historic buildings and boutique condo stock.
Compared with Massachusetts as a whole, Back Bay’s day-to-day costs sit on the higher end.
The Boston metro inflation rate for July 2025 rose about 3.2 percent year over year, and the state’s 2023 median household income was estimated to be a bit above $100,000, which gives you a sense of the statewide baseline that Back Bay tends to exceed.
Crime Breakdown
Year-to-date 2025 property numbers in D-4 are up slightly while the citywide property trend is down, suggesting the district’s retail-heavy environment is pulling more of Boston’s theft activity this year.
Violent categories citywide remain subdued compared with pre-pandemic years, and D-4’s robbery and aggravated assault counts through late August are within the five-year band for a busy in-town district.
Property Crime
Back Bay falls within Boston Police Department District D-4, a district that covers the South End, Back Bay, and parts of the Fenway. District-level reporting is useful because it captures what residents actually feel on the street, including retail thefts near Copley Place and Newbury Street and larcenies from motor vehicles around commercial blocks.
In the most recent year-to-date weekly report through August 24, 2025, D-4 recorded 2,073 Part One property crimes, up about 2 percent from the same 2024 period. Most of those were “other larceny” and larceny from motor vehicles, which are typical of busy shopping and dining areas that draw visitors.
Citywide context helps. For all of Boston in calendar year 2024, property crime totaled about 13,368 incidents, up roughly 4 percent from 2023, with a notable share driven by shoplifting and general larceny. As of mid-2025, year-to-date citywide property totals were trending about 4 percent lower than the same time last year, a sign the 2024 uptick may be easing.
For street-level specifics, Boston’s public crime map and open incident dataset let you filter by offense type and zoom down to individual blocks in Back Bay. Package thefts, bike thefts, and pickpocketing are common urban nuisances that show up under “other larceny,” so those map filters are worth a look if you want to see patterns near your block.
Violent Crime
Violent offenses in D-4 are materially lower in raw count than property offenses and are concentrated in predictable areas and hours.
Through August 24, 2025, D-4 logged 24 rapes or attempted rapes, 65 robberies, 28 domestic aggravated assaults, and 127 non-domestic aggravated assaults, with one homicide reported year-to-date. That profile is consistent with a dense, mixed-use district that blends residents, visitors, nightlife, and major transit stops.
Across Boston in 2024, the city recorded 3,623 total violent crimes, about 1 percent lower than 2023, alongside a modern-era low in homicides. It’s a useful backdrop for reading any neighborhood trend line.
Other Crime
Quality-of-life categories like vandalism, simple assault, and disorder incidents vary by season and block.
You will see spikes tied to game nights, warm-weather foot traffic, and festival weekends. City dashboards and the incident dataset show where graffiti, vandalism, and non-index offenses cluster within Back Bay and along the Boylston and Newbury corridors.
Comparing Back Bay Crime Rates with Massachusetts
Massachusetts posted a statewide decline in Part One crime in 2024 compared with 2023. Boston’s totals moved in a more mixed direction: violent crime down slightly, property crime up modestly on the year.
Back Bay’s district numbers fit the picture you would expect in a high-foot-traffic area within a safe state context, with larceny-type offenses doing most of the work in the statistics.
Citywide rates can help translate counts into something intuitive.
Using Boston’s 2024 totals and the Boston Planning & Development Agency’s population base, the approximate citywide violent-crime rate works out to about 511 incidents per 100,000 residents, while the property-crime rate is about 1,884 per 100,000.
Those translate to rough odds of about 1 in 196 for a violent offense and 1 in 53 for a property offense in a given year, citywide.
Individual risk in Back Bay is usually lower or higher based on block, time of day, and habits like leaving a bag on a café chair or a laptop in a parked car.
Crime Rate Comparison with Nearby Neighborhoods
District comparisons paint a realistic picture of nearby areas residents often consider side by side with the Back Bay.
In the same August 24, 2025, year-to-date report, District A-1, which covers the North End, Beacon Hill, and Downtown, logged 1,418 property crimes, down about 5 percent year over year.
District D-14, which covers Allston-Brighton near Boston University, recorded 634 property crimes, down about 5 percent.
District D-4, which includes Back Bay, sat higher at 2,073 property crimes on the year, up about 2 percent, which reflects the district’s concentration of retail and visitor destinations like Copley Place, Newbury Street, and the Prudential complex.
At the end of 2024, year-end summaries show A-1 tallying about 2,236 Part One incidents and D-4 around 3,174. Those totals line up with what residents notice anecdotally: Downtown and Back Bay absorb more “other larceny” and shoplifting than residential areas farther from the core, while Allston-Brighton’s patterns are shaped by a large student population and off-campus housing.
Chance of Being a Victim of Crime in Back Bay
Because district data group neighborhoods together, Boston publishes citywide rates while offering block-level maps for local checks.
Using the 2024 citywide estimates, the rough annual chance of a violent offense is about 1 in 196 and of a property offense about 1 in 53. In Back Bay, most reported incidents are avoidable opportunities, like unattended bags in cafés or visible items in parked cars.
Scanning the city’s incident map for your specific block and routine is the best way to translate numbers into day-to-day choices.
Role of the Back Bay Police Department
Back Bay is served by Boston Police District D-4.
The district station sits at 650 Harrison Avenue, and D-4’s community team is active across Back Bay, the South End, and the Fenway. If you want to plug into neighborhood meetings or learn about current patterns, the BPD district page and community posts are updated regularly.
For non-emergency service and reporting, Boston’s 311 system routes quality-of-life issues to the right city department and gives you status updates.
Community Safety Initiatives
Neighborhood safety here is a combination of police presence and city services that keep small issues from becoming big problems.
Boston’s 311 system makes it easy to report graffiti, streetlight outages, or damaged signs around Copley Square or along Commonwealth Avenue.
Living in Back Bay: Is it a Safe Place to Live?
Back Bay is one of Boston’s most photographed neighborhoods for good reason. The brownstones, the tree canopy on Commonwealth Avenue, and the river path make daily life feel scenic. It’s popular with home buyers because it combines historic architecture, walkable streets, and proximity to both downtown and the Charles River.
Safety here is less about avoiding “high-crime” blocks and more about managing the common urban risks that come with a popular destination.
On a warm evening, you will see Back Bay residents and visitors mingling in Copley Square, drifting into restaurants and shops, and filing in and out of the Boston Public Library. The setting attracts people. Plan habits accordingly, and you’ll find the neighborhood practical and easy to navigate.
Summary of Crime Statistics
Citywide in 2024, violent crime dipped about 1 percent while property crime rose about 4 percent.
In 2025 so far, property crime totals are trending lower citywide, though D-4’s property counts are a touch higher year to date.
Within D-4, most activity sits in larceny categories tied to shopping and nightlife corridors. Back Bay’s violent categories remain comparatively modest in raw counts for a central Boston district.
Future Outlook for Crime in Back Bay
Massachusetts as a whole saw declines in major crime categories in 2024, and Boston’s 2025 numbers point to continued improvement in several measures.
Given Back Bay’s status as a shopping, dining, and hotel destination, expect property crime to track foot traffic more than anything else. The combination of visible patrols, engaged building staff, active condo associations, and a habit of reporting small issues through 311 tends to keep Back Bay’s everyday safety standards strong for residents and visitors.
Back Bay Safety FAQs
In local terms, Back Bay is a well-patrolled, high-visibility area where most incidents involve theft of unattended items rather than serious violence.
District-level reports show property categories doing the heavy lifting, while violent counts remain relatively contained for a central Boston district.
Looking at the same 2025 year-to-date window, A-1 (Downtown, North End, Beacon Hill) showed fewer property incidents than D-4, while D-14 (Allston-Brighton) sat lower still. The spread lines up with land use.
Retail cores like Back Bay and Downtown naturally record more larcenies, while more residential districts tend to show fewer thefts but different patterns around housing.
Boston maintains a public crime hub that maps incidents by type and time.
You can filter to Back Bay, check “other larceny” or “larceny from motor vehicle,” and scan the last 30 to 90 days within a few blocks of a given address.
Based on 2024 citywide totals and Boston’s population base, the rough annual odds work out to about 1 in 196 for a violent offense and about 1 in 53 for a property offense.
In Back Bay, the practical risk hinges on simple precautions: do not leave bags and laptops unattended, keep car interiors empty, and lock bikes with two locks.
Boston Police District D-4 covers Back Bay and hosts regular community meetings where residents can hear updates and ask questions.
City service issues like streetlights, graffiti, or potholes can be reported through Boston 311, which gives you a case number and status updates.